Introduction
Financial statement analysis can be identified as the process of analyzing a company's financial statements for decision-making purposes. Companies use it to it as a monitoring tool for managing the finance also; External stakeholders use it to understand the overall health of an organization and to evaluate financial performance and business value. The finance statements give a summary of all activities in the company within a particular year. There are four main financial statements in a Public limited company; balance sheet, income statement, statement of equity and cash flow statement.
Reduce uncertainty, application of analytical tools and involves transforming data are the aims of analysing financial statements. Financial statement analyses help users to make better decision. Internal users such managers, officers, internal auditors and External users such shareholders, customers, potential investors, creditors, and government. The financial statement of a company can be recorded financial data to evaluate current, past and projected performance. Information of financial analysis is used for interpretation and compares same type of data. There are several standards of comparison is used to help interpret financial statements; such Intracompany (compare in same company between last two-year company’s performance and this year) Competitor (comparing competitor’s company performance and own company performance) Industry (comparing similar organization together) Guidelines.
In General, Generally Accepted Accounting Principles (GAAP) are at the core of financial reporting (GAAP). The balance sheet, the income statement, and the cash flow statement are the three primary financial statements that must be produced and maintained by a business in accordance with these principles. Standards for financial statement reporting are more stringent for publicly traded corporations. Accrual accounting is required by GAAP, which public corporations must adhere to. Private businesses can choose between accrual and cash accounting, giving them more freedom in how they prepare their financial statements.
Mainly there are tree analysis tools which used as part of financial analysis. They are Horizontal Analysis, Vertical Analysis, and Ratio Analysis. The following report will use these three techniques to interpret data and discuss the financial performance of UNION CHEMICALS LANKA PLC.
About the company
UNION CHEMICALS LANKA PLC
Union Chemicals Lanka PLC (UCLL) is a manufacturing cum trading organization for chemicals & allied products specialized in waterborne polymer dispersions. They are a public quoted company listed in the Colombo stock exchange and a leading supplier of chemical products to Paints, inks, Packaging, Detergents, Cosmetics, Rubber, Latex, Textile, Food and Pharmaceutical industries.
The company began its chemical manufacturing operation in 1984 under Union Carbide Ceylon Ltd. They remained as an affiliate of Union Carbide Corporation (UCC) until year 2000 after which Dow Chemicals acquired UCC and the company was renamed as Union Chemicals Lanka Ltd. In November 2003, Dow Chemicals divested itself from Union Chemicals Lanka Ltd.
UCLL is the pioneering organization for manufacture of waterborne polymer dispersions in Sri Lanka. The company ventured in to the consumer market through manufacturing a range of waterborne coatings for wood and leather. UCLL represents Dow Chemicals (USA), Eastman (USA), Macropolymers Pte Ltd (India), Dominian Color Corporation (Netherlands), and Sunflag Chemicals (India) for a range of chemical products.
Logo of the company

VISION
‘‘To be the most respected Chemical Company in South Asia’’
MISSION
‘‘We are the most customer focused, quality conscious, preferred supplier of industrial chemicals in our key markets. Our people are innovative, empowered, put safety first and act as company owner.’’
Analysing Financial Statements of Union Chemical Company
Financial statement analysis analyses a company's balance sheet, income statement, or statement of cash flows to assess its performance or value. Investors may create a more complex picture of a company's financial profile by utilizing a variety of technologies, such as horizontal, vertical, and ratio analysis. Analysis is consistence with four building blocks. Liquidity and Efficiency, Profitability, Solvency, and Market.
Here, by using these tree techniques, Financial Statements of union chemical company are analysed. First, horizontal analysis involves comparing historical data. Usually, the purpose of horizontal analysis is to detect growth trends across different time periods. Second, vertical analysis compares items on a financial statement in relation to each other. For instance, an expense item could be expressed as a percentage of company sales. Finally, ratio analysis, a central part of fundamental equity analysis, compares line-item data. Price-to-earnings (P/E) ratios, earnings per share, or dividend yield are examples of ratio analysis.
UNION CHEMICALS LANKA PLC
Statement of Profit or Loss and Other Comprehensive Income
For the years’ ended 25th December (2016 to 2021)
UNION CHEMICALS LANKA PLC
Statement of Financial Position
As at 25th December (2016 to 2021)
1. Horizontal Analysis
Horizontal analysis is comparing a company’s financial condition and performance across the time. It is used in financial statement analysis to compare historical data, such as ratios, or line items, over a number of accounting periods. It gives a review of a company's financial statements over multiple periods.
Dollar (Rupee) Change = Analysis period amount – Base period amount (Previous Year)
Percent Change = (Dollar (Rupee) Change/Base period amount) * 100%
Horizontal Analysis of Financial Position (Rupee Change)
Over the year Property, plant and equipment value has significantly increased. Highest Rupee change of total assets is recorded among 2020 and 2021.over the years total assets have gradually increased. Inventories has change has significantly increased over the years. The highest inventory change has recorded among 2020 and 2021. It may cause to pandemic period and due to decrease the demands of chemicals.
Rupee change of total equity has increased over the years between 2020 and 2021 years the total equity has drastically changed.
Rupee change of total liabilities has fluctuated over the years compared to the total assets and total liabilities.
Horizontal Analysis of Financial Position (Percentage Change)
Horizontal Analysis of Income Statement (Rupee Change)
Horizontal Analysis of Income Statement (Percentage Change)
Rupee change of revenue has increased from 2017 to 2021. In 2021, sales have increases more than doubled from 2020. Highest rupee change of gross profit has increased from 2017 to 2021. Total income has increased 59.23% with highest change recorded over five years. It is more than doubled from previous year income. Net financial cost has fluctuated 2017 to 2020and in 2021financial cost has increased drastically. Overall the company has been grown slowly.
Trend Analysis
Trend analysis is a technique used in technical analysis that attempts to predict future stock price movements based on recently observed trend data. Trend analysis uses historical data, such as price movements and trade volume, to forecast the long-term direction of market sentiment
Base period 2016
Trend Analysis = (Analysis Period Amount/ Base Period) * 100%
Trend Analysis of Financial Position

Graph 01: Trend Analysis of Financial Position
According to above graph, easily identified that how total assets, equity and total liabilities has change over the five years comparing with based year of 2016. A total liability has drastically increased than 2016 and 2021. Overall company’s total assets and total equity has significantly increased. But when consider the total liabilities, it has decreased in 2017 and the increased gradually. Overall company has raised their assets and equities. So, further increasing them and by investing or issuing shares they can recover the liabilities.
Trend Analysis of Income Statement

Graph 02: Trend analysis of income statement
Here, cost of sales has gradually increased since 2016. In 2017 and 2018 gross profit has decreased than gross profit of 2016. But since 2018 gross profit is rapidly increased. Company’s sales has rapidly increased compare to 2016 and it show company growth for last five years
Vertical Analysis
In the vertical analysis, each line item in the supplied financial statement is shown as a percentage of the overall account. It is computed for the specified year. Every item under assets and every item under equity and liability are defined in the statement of financial position as a percentage of total assets and liabilities, respectively. Every line item is broken down into a percentage of overall revenue in the income statement.
Common – size percentage = Analysis Amount/Base Amount *100%
Vertical Analysis of Financial Position
Vertical Analysis of the Income Statement
Ratio Analysis
Ratio analysis is a mathematical technique for analysing a company's financial documents, such as the balance sheet and income statement, to gather knowledge about its liquidity, operational effectiveness, and profitability. Fundamental equity research is built on ratio analysis.
Ratio analysis compares line-item data from a company's financial statements to reveal insights regarding profitability, liquidity, operational efficiency, and solvency.
Worling Capital
Working capital indicates does the company have money to run the business for day-to-day expenses, salary payment, bills (outstanding, electricity, telephone bills). Before analyse the finance statements working capital situation should be analysed.
Working capital = Current assets – Current liabilities
Working capital measures, a company’s liquidity and short-term financial health. Over the five years this company shows increasing positive working capital values. That indicates company can fund its current operations and invest in future activities and growth. In 2021, company has highest working capital; it shows a good sign for running the company well. But high working capital isn’t always a good thing it might be indicate that business has too much inventory, not investing its excess cash or not capitalizing on low expense debt opportunity. Further, future growth of the company after 2021 will be depend on how company maintain inventory and other assets.
Liquidity and Efficiency
Current Ratio
This ratio measures the short-term debt-paying ability of the company. This ratio should not be too high because too much liquidity is not suitable for the company. Then they should invest the extra money.
Current ratio = Current assets / Current liabilities
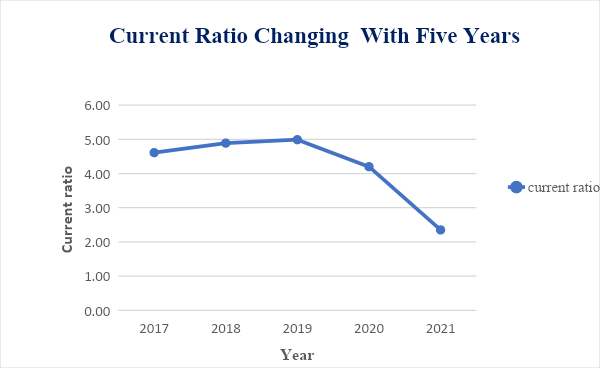
Graph 03: changing of current ratio over the five years
According to the calculated values, this company’s all current ratio values are greater than 1.00 which strong values, it indicates that the company has the financial resources to remain solvent in short-term. 2017-2020’s values are high ratios and they are more than 3.00 related to current assets. it could be indicated that the company can cover its current liabilities more than three times. Also, it may indicate that the company was not using its current assets efficiently, securing financing very well or proper managing its working capital.
According to the graph (Graph 03), it is obvious that there is a gradual improvement during 2017 to 2019. May be due to the corona pandemic followed by economic crisis occurred in the Sri Lankan economy, cause to reduce the demand for the chemical production and chemical industry. It leads to gradually deceased the current ratio in 2020 to 2021.
Acid Test Ratio
This ratio is a quick test as inventory takes to convert to cash. This ratio excludes current assets such as inventories and prepaid expenses that may be difficult to convert into cash quickly. Only consider the company's ability to pay its debt by using assets that can be rapidly converted into cash.
Acid test ratio = Quick assets / Current liabilities
Quick assets = Total current assets – Inventory and Prepayment
This company has reduced the acid test ratio value over the five years. Decreasing acid test ratio is not good. But as all these values are greater than 1 it seems this company has been holding good acid test ratios; as ratios are moderate values it is good means this company has ability to pay current liabilities without inventories.

Graph 04: Changing Acid Test Ratio over the five years
Account Receivable Turnover
Account Receivable Turnover ratio measures how many times a company converts its receivables into cash each year or how effective it is to extend credit and collect the debt. The bigger the value, the better the company’s efficiency.
Accounts receivable turnover =Sales on account / Average account receivables
According to above (graph 05), the company has been maintained good values for account Receivable turnover ratio by increasing values and it was hitting thehighest value in 2021. This indicates a healthy performance.
Merchandise Turnover
This ratio measures the number of times merchandise is sold and replaced during the year related to its cost of sales. This is also referred to as stock turnover and inventory turnover. The higher the value, the better the company's ability in selling goods.
Merchandize turnover = Cost of goods sold / Average inventory
In Union Chemicals Lanka company’s selling has been increasing over the years. But overall, a low inventory turnover ratio values can be observed values (graph 05) shows that company is not in good position in merchandise turnover compare to other values although over the years values has been increased.

Graph 05: Changing merchandise and account receivable turnover
Days' Sales Uncollected
This ratio measures the liquidity of receivables. It gives answer for How many days have to be waited to get cash. Lesser the no. of days, the better the liquidity of the company.
Days’ sales uncollected = (Accounts receivable / Net sales) * 365
In this company, the values have fluctuated over the years, and it is more than 30 days which somewhat weak performance and it means the company is selling its products to customers on credit and waited long time to collect the money. This can lead to cash flow problems in the company.
Days' Sales in Inventory
This ratio measures the liquidity of inventory. Lesser days is good. It indicates efficiency of sales.
Days’ sales in inventory = (Ending inventory / cost of sales) * 365
According to calculated data, it seems the inventory is difficult to sale in the company. The highest number of days is recorded in 2017, but the value has decreased, which is a good sign of company’s health. But The value is near to 100 days or more 100 days which means results of weak performance of the company. The company needs manage their inventory properly.
Total Assets Turnover
This ratio measures the efficiency of assets in producing sales. The value should be greater than 1 to indicate a higher efficiency rate.
Total assets turnover = Revenue / Average total assets
All five years' values are less than one, which implies the average total assets are more than total revenue. This means the company is less efficient towards utilizing assets of company. It might be due to excess production capacity, poor collection method or poor inventory management. From 2020 to 2021 it has increased after 2017 year which good sign for future.
Solvency
Debt Ratio
This ratio measures what portion of a company's assets are contributed by creditors. If debt ratio is greater values, it means company has more assets than debt and company’s risk level is high.
Debt ratio = (Total liabilities / Total assets) *100
The debt ratio has not exceeded more than 30% in any year except in 2021, which means its assets consist of lesser contribution from creditors and company has more assets than debt, means company is in safe level. But in 2021 debt ratio has increased. company should manage the debt level for better future of the company.
Equity Ratio
This ratio measures what portion of a company's assets are contributed by owners. It indicates how financial stable the company may be in the long run.
Equity ratio = (Total shareholder’s equity / Total assets) *100
Approximately, over the year, more than 70% assets are contributed through the owners' equity except in 2021, means the more assets it has financed with stock rather than debt. a good sign.

Graph 06: annual debt ratio and equity ratio
Time Interest Earned Ratio
This ratio measures the ability of a firm's operations to protect the long-term creditor or how strong the company is in paying the interest. The higher the value, the higher the ability of the company. Higher time interest earned ratio is favourable.
Times interest earned = Net income before interest expense and income taxes
Interest expense
The values have fluctuated randomly every year due to different amount of finance cost in each year. Highest value in 2017 means company presents less of a risk to investors and creditors in term of solvency. Considered as acceptable risk, but in 2021 this value has reduced to 14.60. that is not good sign for the company. However overall values are in a good condition. The company has enough cash after paying its debts to continue to invest in the business.
Profitability
Profit Margin
This ratio indicates a company's ability to generate a net profit from sales or the percentage of net profit generated from revenue. The company is more profitable the higher the valuation.
Profit margin = (Net income / Net sales) *100
Here, the profit margin has varied, reaching its highest point in 2021 and its lowest point in 2018. The profit is growing since 2018 annually, which is a strong sign for the functioning of the business.
Graph 07: annual profit margin and gross margin

Gross Margin
This ratio calculates how much of $1(1 Rupee) in sales is left over after operating costs and a profit are taken into account. To exist, a corporation needs a high value.
Gross margin = (Net sales – Cost of sales / Net sales) * 100
Here, as this is a manufacturing company it has larger cost of goods sale than service company. Consequently, Gross margin values are less values, further, in this company’s gross margin has fluctuated over the years and company gained highest value in 2020. The gross margin is not increasing yearly, which is not a good indication of the company's performance. It may strive to slash labour costs or source cheaper supplier of materials. It may decide to increase prices as revenue increasing. This ratio measure company efficiency. Efficiency has reduced 2020 to 2021.
Return on Total Assets
This ratio indicates how effectively a company uses its assets to generate earnings or the proportion of net income from average total assets. This is the best overall measure of a company’s profitability.
Return on total assets = (Net income / Average total assets) * 100
According to this analysis, the highest value recorded is in 2021 and the value has increased since 2018, it seems the company is doing well at increasing the profits with cash investment rupee it spends. Overall, these values are not favourable as all values are below 5% it indicate the company is not been used its assets to generate earnings.
Return on Common Shareholders' Equity
This metric shows how well the business used the owners' capital to generate money, or the percentage of income generated per rupee invested.
Return on common shareholders’ equity = Net income – preferred dividends
Average shareholder’s equity
Here also, the highest value recorded is in 2021 and the value has increased since 2018 to 2021 which shows good performance of the company. It means company’s management doing efficiently at generating income and growth from its equity financing. But when considering the years’ values company’s management is above average at using the company’s assets to create profits.
Book Value Per Common Share
This ratio measures liquidation at reported amounts or the amount a shareholder gets at the situation of the company closing due to bankruptcy.
Book value per common share = shareholders’ equity applicable to common shares
Number of common shares outstanding
According to calculated data, values have increased over the year showing good sign of the company performance. The company can use a portion of its earnings to buy assets that would increase common equity along with book value per share or common stock can be repurchased from shareholders and many companies use earning to buy back shares to increase this ratio.
Basic Earnings Per Share
This ratio is tools for before buying market share. This measure indicates how much income was earned for each share of common stock outstanding. This is an essential factor to consider when buying/selling shares. If the value is high, it is favourable to buy shares and if the value is low, it is unfavourable to buy shares.
Basic earnings per share = (Net income - preferred dividends
Weighted average common shares outstanding

Graph 08: annual basic earnings per share
According to above graph 08, by the years this ratio has increased with showing highest value in 2021 which means the company is profitable and good to invest in. however in 2017 and 2018 not suitable to buy shares.
Market Ratio
Price Earnings Ratio
This metric is frequently used by investors as a broad benchmark for assessing stock values. In general, a company has more potential for growth the higher its price-earnings ratio. This ratio evaluates the market value to earnings per share of the company. This value should be lower value for better results.
Price Earnings per Share = Market price per share / Earning per share
The value has fixed same in 2017 and 2018 but the value is increased from 2019 to 2020. After 2020 it has going down for less value. This indicates that there is a possibility that the company stocks are undervalued. Investors can buy the stock at a discounted price, or it can mean a genuine lack of growth potential.

Graph 09: annual price earnings ratio
Dividend Yield
This ratio identifies the return, in terms of cash dividends, on the current market price of the stock. It shows how much a company pays out in dividends each year relative to its stock price.
Dividend yield = Annual dividends per share
Market price per share
The values have fluctuated throughout the years. The highest dividend yield is recorded in 2019 and lowest values recorded in 2021 which is not good sign. When observing the values, they are in moderate value range. From 2018 to 2019 the dividend yield has increased this could be because their share price is declining, or both. Depending on the circumstances, this may be seen as either a positive or a negative sign by investors. But from 2019 to 2021 the value has decreased. That is not good for the company.

Graph 10: annual dividend yield
Conclusion and Recommendations
The goal of financial analysis is to analyse whether an entity is stable, solvent, liquid, or profitable enough to warrant a monetary investment. It is used to evaluate economic trends, set financial policy, build long-term plans for business activity, and identify projects or companies for investment.
The above report consists of a thorough analysis of Union Chemicals Lanka PLC Company, Data from five financial years were taken, and horizontal, vertical and ratio analyses were performed. The company has shown good performance and revenue growth. Also, the percentage of total assets has been increasing. This Financial analysis determines a company’s health and stability, providing an understanding of how the company conducts its business.
When considering above trend analysis, the company’s overall performance is going well. Especially after 2018 the company show a healthy growing sign. However, when observe the vertical analysis, the vertical analysis shows somewhat lack of property, plant and equipment assets compared to net assets. Although revenue is increased through the years, the cost for gaining the revenue (cost of sale) is huge. The company should focus to reduce cost of sales and suggesting use to new technology and as this is a chemical industry, new reaction steps and new method which reduced production cost can be discovered by helping the R&D department. Then wastage cost can be reduced and waste can be reused to earning more profit. When consider the ratio analysis, these tests performed, the company's liquidity position is at a healthy state.
But by observing liquidity ratios It seems that the company has not maintained their inventory properly. Those are manageable problems. The company can increase sales by promotions, advertising etc. in solvency ratio the company is in favourable state. Company has lower risk for liabilities. In profitability the company should more attention for earning profit more. increasing the price or increasing volume of unit sold or both will help to increase profit. But practically, a price rise is possible only to the extent of not losing the competitive edge in marketplace, while sale volumes remain depend on market dynamics like overall demand percentage of market share commanded by the business, and competitors’ existing position and future moves. So, company should consider all these factors. The company needs well managed and planed strategies for each division. Also, the company should give special attention to their inventory strategies and in making policies to stabilize the company performance.


No comments:
Post a Comment